- Based on ECG Blog #292 (www.tinyurl.com/KG-Blog-292 )
- LINK to this Page — www.tinyurl.com/KG-MedAll-351 — I have not yet made this link ...
- LINK to VIDEO of My Talk (November 9, 2023) — It will hopefully take me less than 1 week to edit the Video of my Nov. 9 presentation ....
.png)
.png)
.png)

- In view of this history — How would YOU interpret this ECG?
- Should the cath lab be activated?
.png)

-USE.png)


 |
| Figure-2: Comparison between the 2 ECGs recorded in today's case. ECG #2 was actually done first, at the time the EMS unit arrived on the scene (at which time the patient was having severe chest pain). About 20 minutes later (on the way to the hospital) — the patient's CP resolved, and ECG #1 was recorded. |

-USE.png)
-USE.png)
-USE.png)
-USE.png)


==========================
MAKE A POLL for Nov. 16 !!!!!!
Should the Cath Lab be activated?
— No. This is not a STEMI (ie, not enough ST elevation).
— No — because the patient's chest pain is gone.
— Yes — IF the initial troponin value is positive.
— Yes. This is an acute OMI.
==========================
In My 2nd Series of 3 Talks (Nov. 2,9,16 — 2023) — I will present a user-friendly approach to Systematic 12-lead ECG interpretation — with a focus on HOW to Recognize acute OMI ( = acute coronary Occlusion-based Myocardial Infarction) — when STEMI criteria are not present.
My GOAL is to illustrate via specific ECG examples how the "STEMI Paradigm" is outdated — because it overlooks many acute OMIs that would benefit from prompt cardiac cath with PCI. Today's case is based on ECG Blog #351 (https://tinyurl.com/KG-Blog-351 ).
ECG Blog #205 (https://tinyurl.com/KG-Blog-205 ) — reviews my Systematic Approach.
ECG Blog #246 (https://tinyurl.com/KG-Blog-246 ) — reviews the Mirror Test.
ECG Blog #193 (https://tinyurl.com/KG-Blog-193 ) — reviews the concept of OMI (predicting the "Culprit" Artery).
======================
NOTE: I have had to cancel a 4th session in this series that had been scheduled for Nov. 30. Therefore — my 3rd session on November 16, 2023 will be the LAST session in this series.
- In view of this history — How would YOU interpret this ECG?
- Should the cath lab be activated?
-USE.png) |
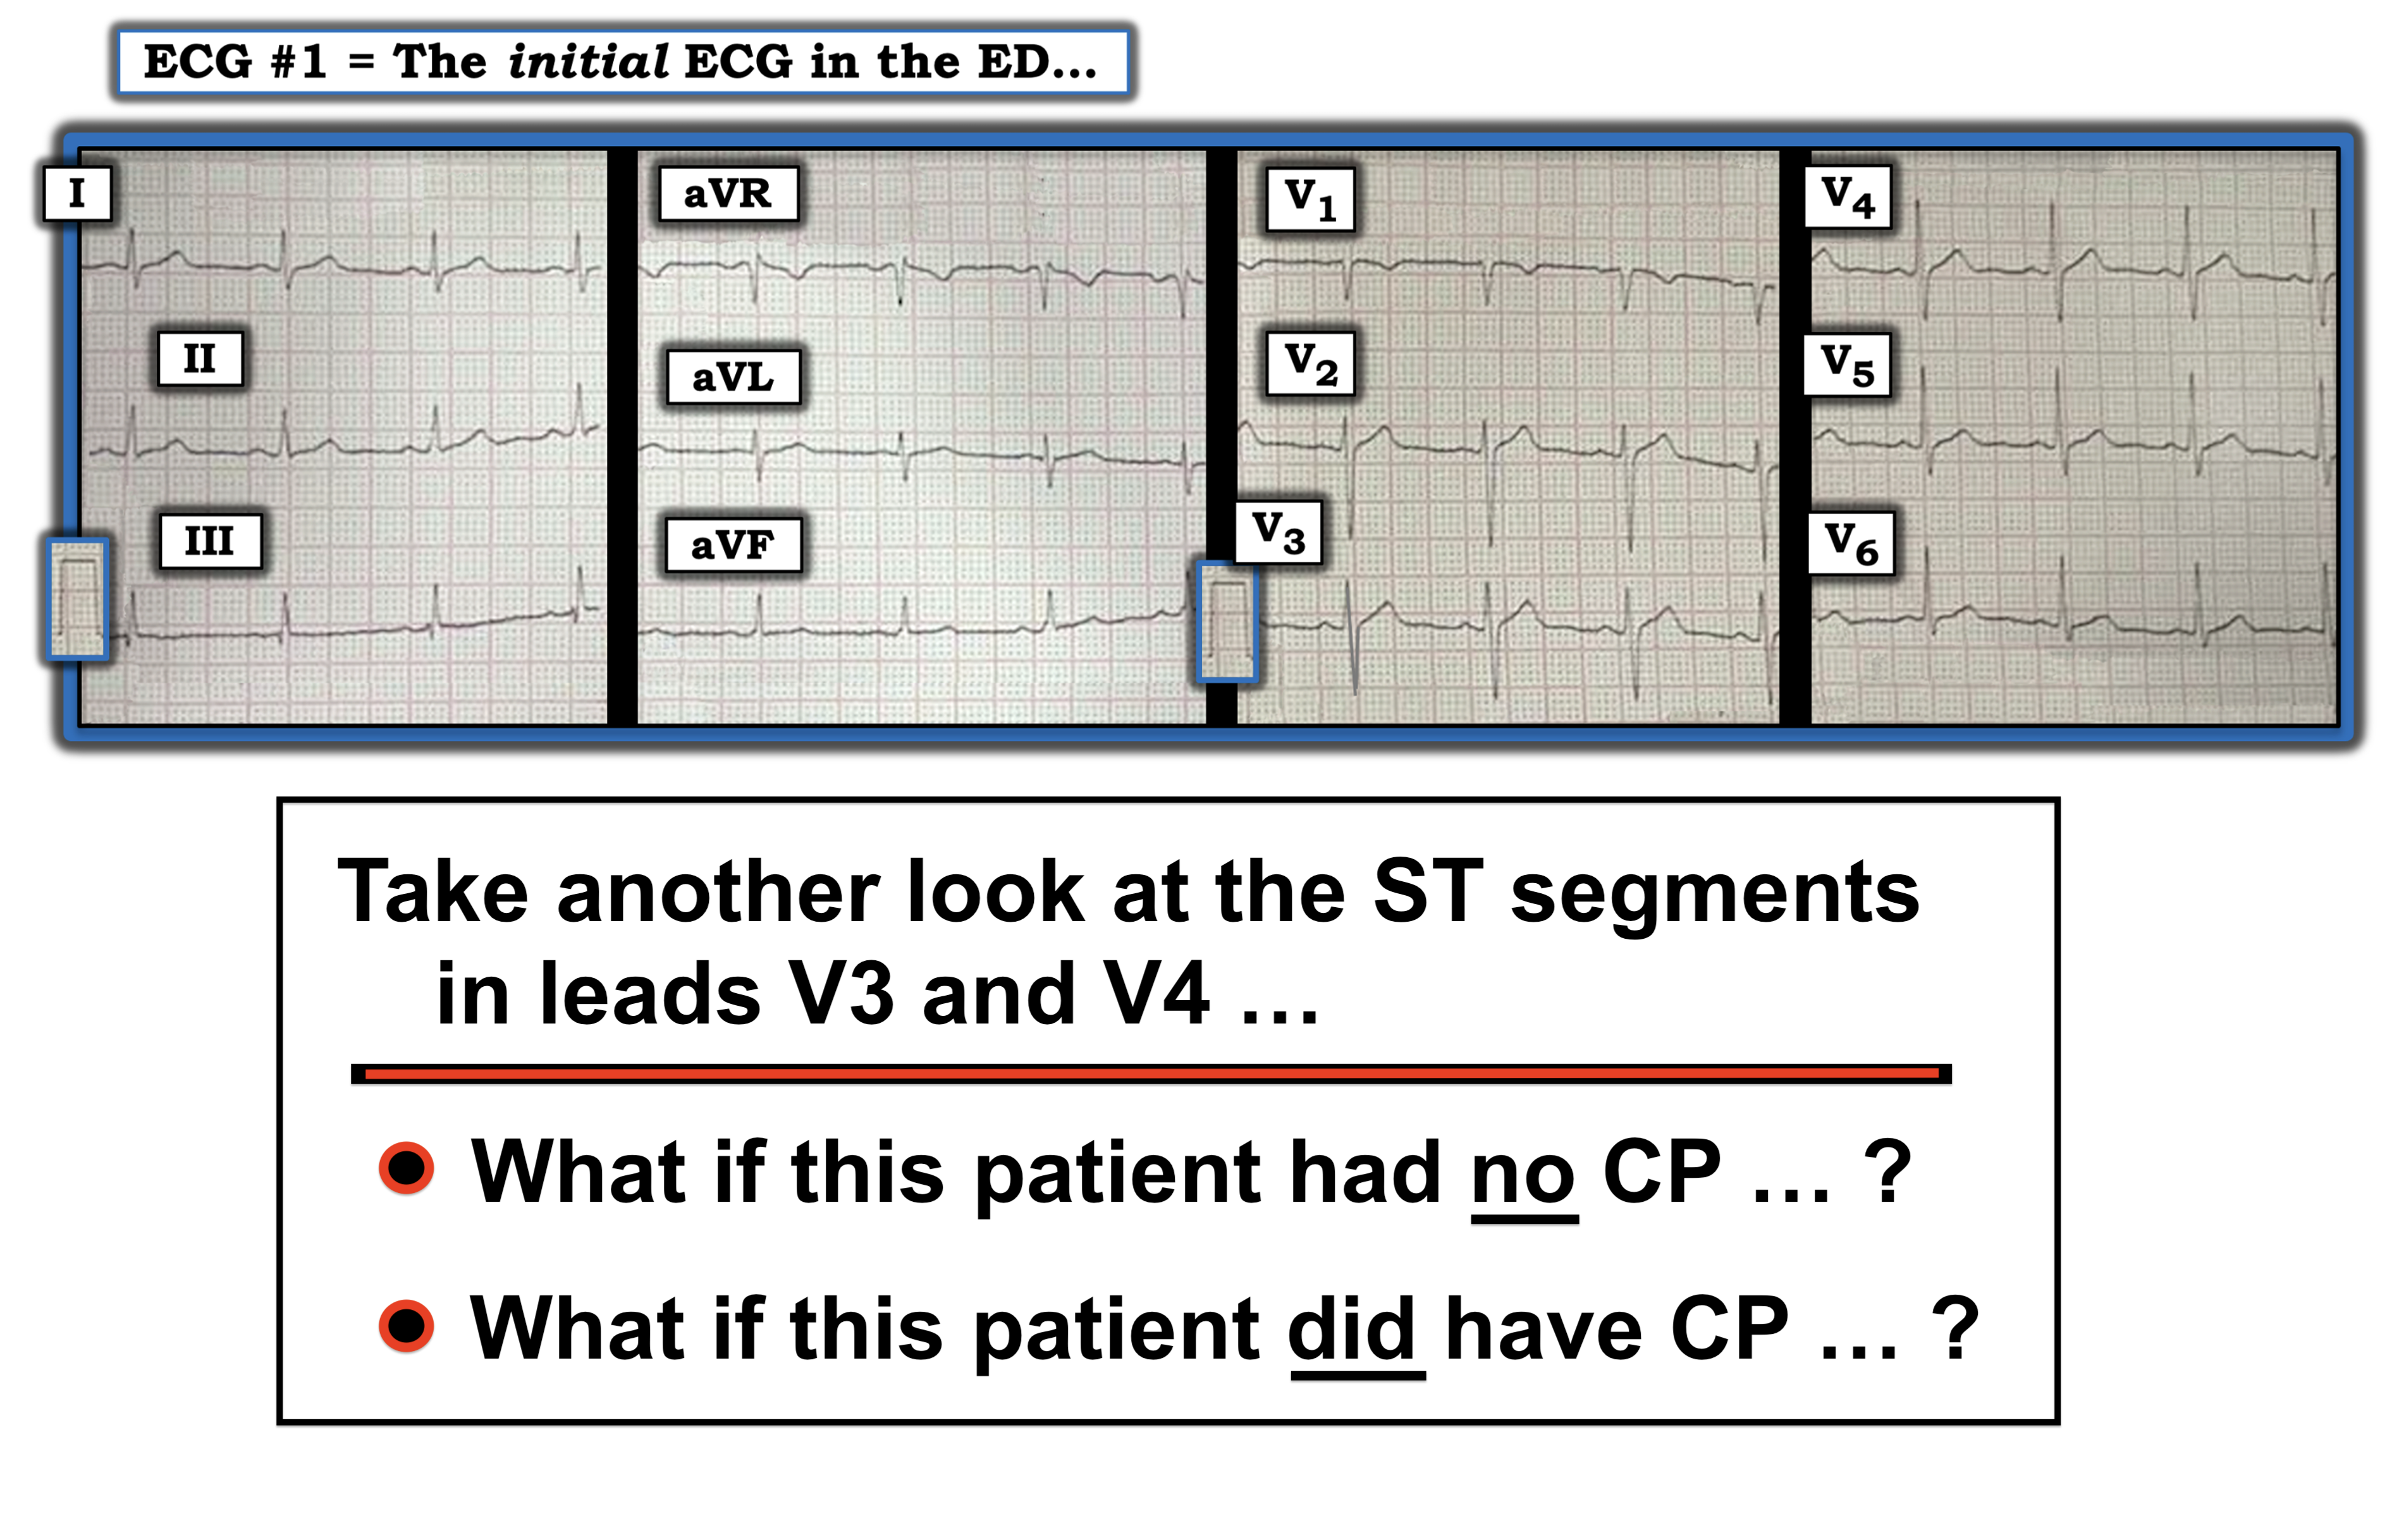
| Figure-1: The initial ECG in today's case. (To improve visualization — I've digitized the original ECG using PMcardio). |
- The rhythm is sinus bradycardia at ~55-60/minute.
- The PR and QRS intervals are both normal. The QTc may be of borderline duration, but does not appear to be overtly prolonged.
- The frontal plane axis is leftward, consistent with LAHB (Left Anterior HemiBlock) — as the QRS complex in lead II is predominantly negative.
- There is no chamber enlargement.
- There is a potentially significant Q wave in lead aVL — in that this Q wave seems wider-than-it-should-be considering small amplitude of the QRS in this lead.
- R Wave Progression — overall is not necessarily abnormal (ie, since initial r waves are present in each of the first 3 anterior leads — with significant R wave amplitude occurring by lead V4, as it should). That said — the r wave in lead V3 is still relatively small at ~2 mm (NOTE: My concern about an acute anterior event is less if the r wave in anterior leads is taller, rather than as modest in size as we see in ECG #1).
- The most remarkable finding in ECG #1 — relates to the presence of tall, peaked T waves in multiple leads (ie, in leads II,III,aVF; and in leads V2-thru-V6). These T waves are disproportionately tall with respect to the R waves in these leads (ie, The T waves in leads V2,V3 tower over the 2mm r waves in those leads — and the tall T waves in leads II,III,aVF and in V4,V5,V6 are of comparable [if not greater] height than R waves in these leads).
- These tall T waves are associated with flattening (straightening) of the ST segment in the inferior leads — with slight ST elevation in leads V2-thru-V6 (albeit not enough to qualify as a "STEMI" — Akbar et al, StatPearls, 2023). That said, these are hyperacute T waves, in that they are "hypervoluminous" (ie, taller and "fatter"-at-their-peak than they should be — with a wider-than-it-should-be T wave base, especially in leads V2-thru-V5).
- Lead aVL shows reciprocal changes to what is seen in the inferior leads (ie, ST segment coving with slight elevation is seen in lead aVL — followed by symmetric T wave inversion in this lead that manifests an inappropriately widened Q wave).
- Given markedly hyperacute T waves that begin as early as in lead V2, continuing through to lead V6 — with abnormal ST-T waves in leads II,III,aVF and aVL — ECG #1 most likely represents acute proximal LAD (Left Anterior Descending) occlusion.
- As discussed in many posts in this ECG Blog — despite not satisfying the millimeter-based definition of a STEMI — in this patient with new chest pain, the ECG findings in Figure-1 merit prompt cath lab activation without any need to wait for serum troponin to return elevated (See ECG Blog #193 — regarding the new "OMI" paradigm).
- The importance of correlating the presence (and relative severity) of CP with each serial ECG recorded on the patient — is that doing so may provide insight as to whether the "culprit" vessel at any time during the process is likely to be open or closed.
- The "culprit" coronary artery is more likely to be occluded IF — the patient has ongoing severe CP (Chest Pain), especially if this occurs in association with ST elevation over the area of infarction.
- Spontaneous reperfusion is likely IF — in association with reduction (or resolution) of CP, the ST elevation and reciprocal ST depression significantly improve.
- Reperfusion of the "culprit" artery is even more likely IF — in association with CP resolution, one sees "reperfusion" T waves (ie, T wave inversion) in areas where there had been ST elevation.
- KEY Point: Somewhere in between the phase of acute ST elevation and return of ST segments to baseline — may be a "transition" phase of pseudo-normalization, during which time the ECG may look relatively normal (or show no more than nonspecific ST-T wave flattening). IF attention is not paid to the presence and relative severity of CP in association with each serial ECG — it could be extremely EASY to overlook recent OMI if the initial ECG is being viewed during this phase of pseudo-normalization.
- This is the reason why despite not satisfying millimeter-based STEMI criteria — ECG #1 is diagnostic of an acute OMI until proven otherwise (and merits prompt cath with probable need for PCI).
- Therefore — a single hs-troponin value within the "normal" range does not rule out OMI. (This point is discussed in detail in the March 24, 2023 post of Dr. Smith’s ECG Blog).
- On the contrary — IF the initial hs-troponin value comes back normal (as it may — as emphasized in PEARL #3) — it is all-too-easy to be falsely reassured by an initially normal hs-troponin — which may cause further delay in performing the needed cath (which could turn out to be a lethal mistake — IF the “culprit” artery spontaneously reoccludes while providers are waiting “until” the hs-troponin finally becomes elevated).
- For example, in the March 24, 2023 post that I refer to above — not only the 1st hs-troponin ( = 4 ng/L), but also the 2nd hs-troponin value obtained 2 hours later ( = 16 ng/L) were within the "normal" range (which for this particular hs-troponin assay was ≤16 ng/L for women; ≤26 ng/L for men).
- As emphasized in the discussion of this March 24 case by Dr. Smith — the 2-to-3 hour "Delta" (ie, the difference between the 1st and 2nd hs-troponin values) — should be less than 3 ng/L. Therefore, despite both of these first 2 hs-troponin assays falling within the “normal” range — the delta of 12 ng/L (ie, 16 ng/L — followed by 4 ng/L) is clearly abnormal, and indicative of acute OMI until you can prove otherwise.
- NOTE: The reason I began today's case with ECG #1 — is to emphasize a number of important points.
-USE.png) |
| Figure-2: Comparison between the 2 ECGs recorded in today's case. ECG #2 was actually done first, at the time the EMS unit arrived on the scene (at which time the patient was having severe chest pain). About 20 minutes later (on the way to the hospital) — the patient's CP resolved, and ECG #1 was recorded. |
- In the Limb Leads: Although QRS morphology looks similar in ECG #1 and ECG #2 — there clearly was more ST elevation in leads I and aVL and much more reciprocal ST depression in the inferior leads at the time ECG #2 was obtained.
- In the Chest Leads: ST elevation is so dramatic in ECG #2, as to be evident from across the room (ie, with the amount of ST elevation exceeding 5 mm in leads V2,V3,V5 — and attaining 10 mm in lead V4).
- It is of note that chest lead R wave amplitude was much greater in the initial ECG in today's case ( = in ECG #2).
- KEY Point: When the EMS team first arrived on the scene — the patient had severe CP in association with the tall chest lead R waves seen in ECG #2, with marked ST elevation and marked reciprocal inferior lead ST depression.
- Just 20 minutes later, ECG #1 was obtained — at which point the patient's chest pain had resolved, in association with significant loss of chest lead R wave amplitude and near resolution of ST segment elevation and reciprocal depression. Without the ST segment elevation and depression — only the hyperacute T waves remain in ECG #1.
- That the proximal LAD was acutely occluded when the patient was having severe CP (on EMS arrival — when ECG #2 was obtained).
- That the "culprit" artery spontaneously opened ~20 minutes later while the EMS unit was en route to the hospital (at which time the patient's CP had resolved — and ECG #1 was obtained).
- That despite resolution of the patient's CP and of ST segment elevation and depression — that prompt cath with PCI remained essential in this patient who otherwise would be at risk that the "culprit" artery might at any moment spontaneously reocclude.
- Final "Take-Home" Point: Imagine if ECG #2 had not been obtained — and instead, the first (and only) EMS tracing was ECG #1. This is why correlation of the timing of the presence (and severity) of symptoms in association with each ECG obtained is essential — and why in a case such as this one, the hyperacute T waves in ECG #1 despite not satisfying millimeter-based STEMI criteria are more than enough to justify prompt cath without the need to wait for a positive troponin value.
- ECG Blog #205 — Reviews my Systematic Approach to 12-lead ECG Interpretation.
- ECG Blog #185 — Reviews the Ps, Qs, 3R Approach to Rhythm Interpretation.
- mmm
- ECG Blog #193 — Reviews the concept of why the term “OMI” ( = Occlusion-based MI) should replace the more familiar term STEMI — and — reviews the basics on how to predict the "culprit" artery.
- ECG Blog #194 — Reviews how to tell IF the “culprit” (ie, acutely occluded) artery has reperfused using clinical and ECG data.
- ECG Blog #294 — How to tell IF the "culprit" artery has reperfused.
- ECG Blog #183 — Reviews the concept of deWinter T-Waves (with reproduction of the illustrative Figure from the original deWinter NEM manuscript).
- ECG Blog #318 — ECG Blog #340 — and ECG Blog #341 — More on deWinter and deWinter-like T waves.
- ECG Blog #218 — Reviews HOW to define a T wave as being Hyperacute?
- ECG Blog #260 — ECG Blog #222 — and ECG Blog #292 — Reviews when a T wave is hyperacute — and the concept of "dynamic" ST-T wave changes.
- ECG Blog #387 — Dynamic change in 2 minutes.
- ECG Blog #230 — How to compare serial ECGs.
- ECG Blog #337 — an OMI misdiagnosed as an NSTEMI ...
- ECG Blog #184 — illustrates the "magical" mirror-image opposite relationship with acute ischemia between lead III and lead aVL (featured in Audio Pearl #2 in this blog post).
- ECG Blog #167 — another case of the "magical" mirror-image opposite relationship between lead III and lead aVL that confirmed acute OMI.
- ECG Blog #271 — Reviews determination of the ST segment baseline (with discussion of the entity of diffuse Subendocardial Ischemia).
- ECG Blog #258 — How to "Date" an Infarction based on the initial ECG.
- The importance of the new OMI (vs the old STEMI) Paradigm — See My Comment in the July 31, 2020 post in Dr. Smith's ECG Blog.
- For review on when despite acute OMI — the initial hs-troponin may come back normal — See the March 24, 2023 post in Dr. Smith’s ECG Blog.

-USE.png)
- I've added several Audio Pearls below with material relevant to today's case.

Today’s ECG Media PEARL #1 (3:00 minutes Audio) — Reviews the concept of deWinter T waves (and the common occurrence of variations on this "theme" ).

ECG Media PEARL #35a (4:50 minutes Audio) — WHEN is a T Wave Hyperacute vs a Repolarization variant?

ECG Media PEARL #39a (4:50 minutes Audio) — Reviews the concept of Dynamic ST-T Wave Changes (and how this ECG finding can assist in determining if acute cardiac cath is indicated).

ECG Media PEARL #46a (6:35 minutes Audio) — Reviews HOW to compare Serial ECGs (ie, Are you comparing "Apples with Apples" — or — with Oranges?).


- Based on ECG Blog #292 (www.tinyurl.com/KG-Blog-292 )
- LINK to this Page — www.tinyurl.com/KG-MedAll-351 — I have not yet made this link ...
- LINK to VIDEO of My Talk (November 9, 2023) — It will hopefully take me less than 1 week to edit the Video of my Nov. 9 presentation ....


-USE.png)
-USE.png)

-WHY_Wide-USE.png)
-WHY_Wide-USE.png)


-What_to_Know-USE.png) |

-USE.png)

- How would YOU interpret the serial tracings shown in Figure-1?
- WHY did the patient die?
 |
| Figure-1: The 2 ECGs in today's case (See text). |
=======================================
NOTE: I'm repeating the following Audio PEARLS that are relevant to today's case. Some readers may prefer at this point to listen to these Audio Pearls before reading My Thoughts that appear below, regarding the ECGs in today's case.
=======================================
ECG Media PEARL #39a (4:50 minutes Audio) — Reviews the concept of Dynamic ST-T Wave Changes (and how this ECG finding can assist in determining if acute cardiac cath is indicated).
ECG Media PEARL #46a (6:35 minutes Audio) — Reviews HOW to compare Serial ECGs (ie, Are you comparing "Apples with Apples" — or — with Oranges?).
- What is meant by the term, "dynamic" ECG changes?
- How to compare serial tracings?
- Are "dynamic" ECG changes seen in Figure-1?
- What is the most likely reason this patient died?
- Can we determine a "culprit" artery?
- IF ECG changes evolve in a way that corresponds to the coming and going of chest pain symptoms — this is important information. It tells us there is an active, ongoing process — and that prompt cath with acute reperfusion is likely to be needed regardless of whether or not the millimeter-definition of a STEMI has been satisfied.
- The problem is — that the "culprit" artery may spontaneously open and close more than once during its process of arriving at a final result — so that even if ST elevation resolves in association with resolution of chest pain — this spontaneous reopening of the vessel, may just-as-easily be followed by spontaneous closure again — and this time, perhaps without spontaneous reopening.
- It is this active evolution of ST-T wave changes that may occur with the coming and going of symptoms that we define as "dynamic" ECG changes. ST segments elevate with the onset of chest pain (signaling acute coronary occlusion) — and ST segments return toward their baseline, often followed by "reperfusion" changes of T wave inversion that signal reopening of the "culprit" vessel. The importance of recognizing these "dynamic" ECG changes — is that this indicates an unstable situation at risk of evolving further to permanent coronary occlusion.
- We are looking for changes in the shape and amount of ST elevation and depression between the tracings that we are comparing.
- The challenge with ECG comparison — is that we have to distinguish between differences from one ECG to the next that are likely to be due to a worsening or improvement in the patient's coronary disease — versus — ECG changes that are likely the result of technical factors (ie, a shift in frontal plane axis or QRS morphology changes due to a difference in lead placement or in the degree of elevation of the patient's bed [some acutely ill patients are unable to lie flat]).
- After full interpretation of the initial ECG you looked at — I go lead-to-lead when I compare serial tracings, holding both tracings right next to each other. This is because IF, for example — the QRS complex is predominantly positive in lead III or in lead aVF on the 1st tracing — but then becomes more-negative-than-positive on the 2nd tracing — then the frontal plane axis has shifted! — and — you'll need to consider this axis shift when determining whether any differences in ST-T wave morphology are likely to be due to technical factors or "true" evolution of the patient's cardiac condition.
My THOUGHTS on the Initial ECG in Figure-1:
I began assessing today's case with interpretation of the initial ECG in the ED ( = ECG #1). As always — I used a Systematic Approach (See ECG Blog #205 for details):
- Rate & Rhythm: There is a fairly regular sinus rhythm at ~80-85/minute.
- Intervals (PR, QRS, QTc) — Normal.
- Axis: Normal (about +65 degrees — given slight negativity of the QRS in lead aVL).
- Chamber Enlargement: None.
Regarding Q-R-S-T Changes:
- Q Waves: No Q waves of note. There appears to be a small initial r wave in lead III (which manifests an rsR' complex). The Q waves seen in leads aVR and V1 are so common (and normal) that I generally don't mention them. No other Q waves.
- R Wave Progression: Normal. Transition (where height of the R wave exceeds depth of the S wave in the chest leads) occurs normally (ie, here between leads V3-to-V4).
Regarding ST-T Wave Changes:
- There is nonspecific ST-T wave flattening in leads III and aVF.
IMPRESSION: Overall, I thought ECG #1 was unremarkable for a patient who presented with new chest pain. The nonspecific ST-T wave flattening seen in leads III and aVF is often seen in patients without chest pain.
My THOUGHTS on ECG #2:
As noted in Figure-1 — ECG #2 was obtained 1 hour after ECG #1 in this 30-something year-old man, who presented to the ED with several hours of chest pain.
- Once again — My assessment of the ST-T wave appearance in ECG #2 for this patient with chest pain was fairly unremarkable — and by itself, did not suggest acute changes.
- Do YOU see any differences in ST-T wave morphology in any of the 12 leads?
- What clinical information do we need to know in order to optimally interpret these 2 tracings?
|
| Another Look at Figure-1: The 2 ECGs in today's case. |
- In the Limb Leads: QRS morphology and amplitude, as well as the frontal plane axis — are virtually identical in ECG #2, compared to what was seen in ECG #1.
- In the Chest Leads: Considering that half-standardization was used to record the chest leads in ECG #2 — I saw no significant difference in R wave progression or QRS morphology between the 2 tracings.
- KEY Point: Knowing that frontal plane axis and chest lead electrode placement is comparable in ECG #1 and ECG #2 greatly facilitates comparison of these serial tracings. This tells us that any significant change that we see between ECG #1 and ECG #2 is likely to be real.
- In the High-Lateral Leads: The T waves in leads I and aVL of ECG #1 were slightly larger (more upright) in this earlier tracing — than they are in ECG #2.
- In the Inferior Leads: Although I do not see any difference in the ST-T wave appearance in lead II — T waves in the other 2 inferior leads (leads III and aVF) are more upright in ECG #2, compared to what they were in ECG #1.
- In the Chest Leads: Even accounting for the change in standardization — the T waves in leads V2-thru-V6 are flatter in ECG #2 than they were in ECG #1. The T wave in lead V1 is less deeply inverted in ECG #2.
- The KEY clinical information missing in this case — is an account of what happened to the severity of this patient's chest pain between the time that these 2 ECGs were recorded.
- IF there was in fact a change in the severity of this patient's symptoms — this would strongly support the premise that there are ongoing dynamic ST-T wave changes. For example — IF chest pain was significantly less at the time ECG #2 was recorded, this might indicate evolution of acute LAD (Left Anterior Descending) occlusion, in which spontaneous reperfusion signaled what was soon to become anterior reperfusion T waves ( = anterior T wave inversion).
- In this case — IF an ECG had been recorded a bit before ECG #1, perhaps it might have revealed "tell-tale" anterior ST elevation.
- BOTTOM Line: Without knowing details about the course of this patient's chest pain — it's impossible to predict a probable "culprit" artery. But IF there was indeed a significant change in the severity of this patient's symptoms between the time that ECGs #1 and #2 were recorded — this would have been clear indication for prompt cath.
- "Take-Home" Message #1: The course of acute coronary occlusion is sometimes stuttering. That is, the "culprit" artery may completely occlude — only to spontaneously open a short time later. IF the duration of complete occlusion is brief (ie, minutes) — then even high-sensitivity troponin may not necessarily elevate. When ST-T wave changes correlate with the "coming-and-going" of symptoms — these ECG findings strongly suggest onging change in the patency of the "culprit" artery. The reason these dynamic ST-T wave changes are indication for prompt cath — is that what was totally occluded (and is now open) — might just as easily occlude again at any time, until the final state of the culprit artery is ultimately reached.
- "Take-Home" Message #2: The ECG findings in today's case are subtle — and neither ECG #1 nor ECG #2 alone suggested an ongoing acute event. But when one considers that no less than 10/12 leads show a subtle-but-real difference in ST-T wave morphology in this patient with new chest pain — the strong indication for prompt cath that was advised is undeniable. This patient might still be alive IF he had not ignored this recommendation.
- Final "Take-Home" POINT: Recognition of dynamic ST-T wave changes sometimes requires meticulous lead-by-lead comparison of serial ECGs, interpreted in association with the serial course of the patient's symptoms.
Related ECG Blog Posts to Today’s Case:
- ECG Blog #205 — Reviews my Systematic Approach to 12-lead ECG Interpretation.
- ECG Blog #183 — Reviews the concept of deWinter T-Waves (with reproduction of the illustrative Figure from the original deWinter NEJM manuscript).
- ECG Blog #222 — Reviews the concept of Dynamic ST-T wave changes, in the context of a detailed clinical case.
- ECG Blog #260 — Reviews another case that illustrates the concept of "dynamic" ST-T wave changes.
- ECG Blog #218 — Reviews HOW to define a T wave as being Hyperacute?
- ECG Blog #230 — Reviews HOW to compare Serial ECGs (ie, "Are you comparing Apples with Apples or Oranges?").
- ECG Blog #193 — Reviews the concept of why the term “OMI” ( = Occlusion-based MI) should replace the more familiar term STEMI — and — reviews the basics on how to predict the "culprit" artery.
- ECG Blog #194 — Reviews how to tell IF the “culprit” (ie, acutely occluded) artery has reperfused using clinical and ECG data.
- ECG Blog #115 — Shows an example of how drastically the ECG may change in as little as 8 minutes.
- The January 9, 2019 post in Dr. Smith's ECG Blog (Please scroll down to the bottom of the page to see My Comment). This case is remarkable for the dynamic ST-T wave changes that are seen. It's helpful to appreciate: i) That acute ischemia/infarction is not the only potential cause of such changes (cardiac cath was normal); ii) That changes in heart rate, frontal plane axis and/or patient positioning can not always explain such changes; and, iii) That entities such as repolariztion variants, LVH and/or acute myopericarditis may all contribute on occasion to produce an evolution of challenging dynamic ST-T wave changes on serial ECGs.
- The August 22, 2020 post in Dr. Smith's ECG Blog — which illustrates another case of dynamic ST-T wave changes that resulted from a repolarization variant.
- The July 31, 2018 post in Dr. Smith's ECG Blog (Please scroll down to the bottom of the page to see My Comment). This case provides an excellent example of dynamic ST-T wave changes on serial tracings (that I illustrate in My Comment) in a patient with an ongoing acutely evolving infarction.
No comments:
Post a Comment